Decide What You Will Measure Before You Launch: Building Impact Reporting That Lasts
Decide What to Measure Before You Launch: Impact Reporting That Lasts

The program is funded, the launch date is set, and the survey link is ready to send. Then someone asks a simple question: what exactly are we trying to show at the end?
If the room goes quiet, you are in good company. Many teams tackle the complexity of launching first and sort out data later. The hurdle surfaces months down the road, when a regulatory body, a board, a funder, or a district office asks for results and someone has to rebuild the story from inboxes, exports, and memory.
This is not a discipline problem. Rather, it is a sequencing problem. Reporting gets built at the end because it gets decided at the end. Flip the order and most of the scramble disappears.
This article covers what to decide before launch, where your data should live, and how to build reporting that keeps working after the program wraps. It applies whether you run a grant portfolio, a public agency program, a school or district initiative, or another impact initiative with outcomes to prove.
Why Does Program Reporting Turn Into a Scramble?
Program reporting turns into a scramble because the questions get set after the data is already collected. By then, the information lives in whatever format was convenient at the time: a form here, a spreadsheet there, a folder of attendance sheets, an email thread with the one number everyone needs.
Three patterns show up again and again in the programs we see:
- Collection comes before purpose. Teams gather what is easy to gather, then discover it does not answer what stakeholders are asking.
- Every report is a one-off. Each request starts from scratch because nothing was built to be reused.
- Nobody owns the definitions. Two people count "participant" differently, and the totals never quite match.
None of these require new technology to fix. They require a few decisions made early and written down.
What Should You Decide Before a Program Launches?
Before launch, decide five things: who will use the results, what they will do with them, which outcomes matter, how each outcome will be measured, and who owns the data. Together, these form a short measurement plan you can fit on one page.
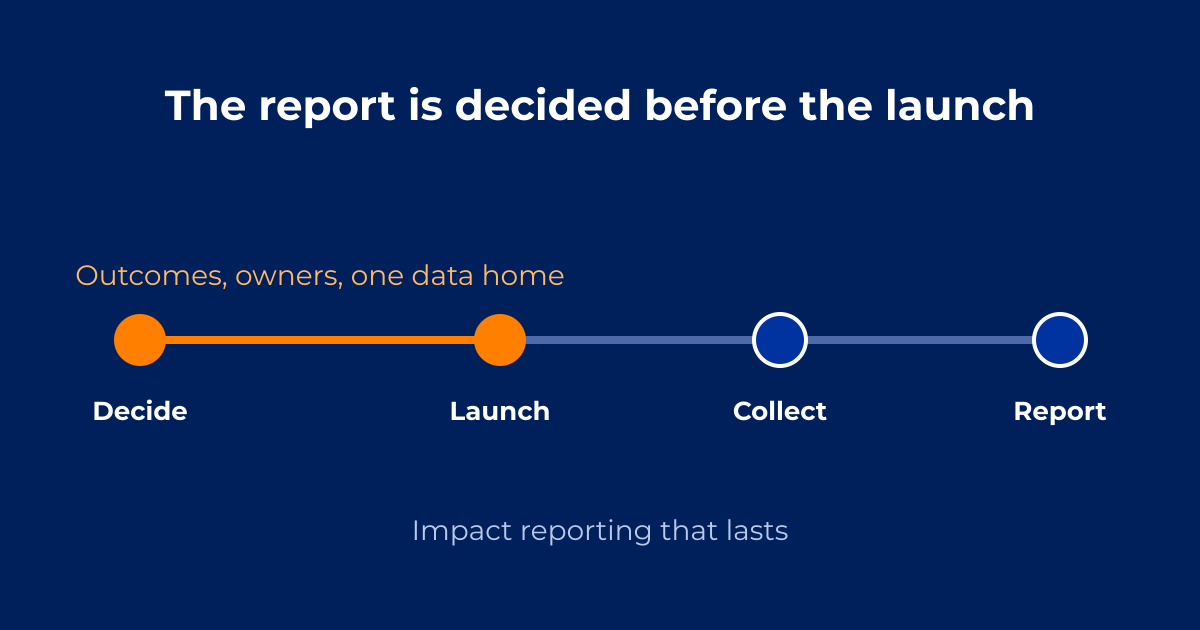
The evaluation guidance from the Centers for Disease Control and Prevention (CDC) makes the same point from a planning angle. Its framework says to settle your evaluation's purpose and questions before choosing methods, and it treats the audience and their intended use as the main drivers of design. In the framework's words, the right design depends on the question being asked, who is asking it, and what will be done with the answers.
That order matters. Here is how to apply it:
- Who will use the results? Name the actual audiences. A funder reviewing a portfolio needs different evidence than a program manager adjusting next month's schedule, and a school leadership team needs different evidence than a board. List each audience and what they will decide based on what you show them.
- What will they do with it? Results that never change a decision are overhead. Write down the decision each report supports: renew funding, expand to a second site, change a curriculum, reassign staff. If a data point supports no decision, question whether you need to collect it.
- Which outcomes matter most? Pick a small number. A program that tries to measure twenty outcomes usually measures none of them well. The CDC framework suggests prioritizing evaluation questions by whether they fit the program's stage, connect to its logic model, stay manageable in number, would produce useful findings, and can actually be answered. Those five filters work well for outcomes, too.
- How will each outcome be measured? For every outcome, write the exact measure, the source, the timing, and the unit. "Students feel more confident" is a hope. "Percent of participants who rate their confidence at four or five on a five-point scale at the start and end of the program" is a measure.
- Who owns the data and the definitions? Assign one named owner for each measure. That person decides what counts, signs off on changes, and answers questions when two numbers disagree.
How Do You Turn Outcomes Into Questions You Can Actually Collect?
Work backward from the report you will need to produce. Draft the sentence you hope to write at the end, with blanks for the numbers:
"Of the ___ participants who joined, ___ percent completed the program and ___ percent reported ___."
Each blank is a data point, and each data point needs a collection method, a moment in the program when you will collect it, and a place for it to land. If you cannot say all three, you have found a gap while it is still cheap to fix.
A few habits keep the question list honest:
- Collect once, use many times. Ask each question in one place, not three. Duplicate questions create duplicate answers that disagree.
- Keep surveys short and purposeful. Every question should map to an outcome on your plan. If it does not, cut it.
- Capture identifiers up front. Decide how a participant at intake will be matched to the same participant at completion. Without a consistent identifier, before-and-after comparisons become guesswork.
- Define terms in writing. What counts as "enrolled," "active," or "completed"? Put the definitions where everyone can see them.
Where Should Your Program Data Live?
Your program data should live in one reliable home: a single system of record where every measure is stored once, in a consistent structure, with clear ownership. Reports then read from that home instead of being assembled by hand.
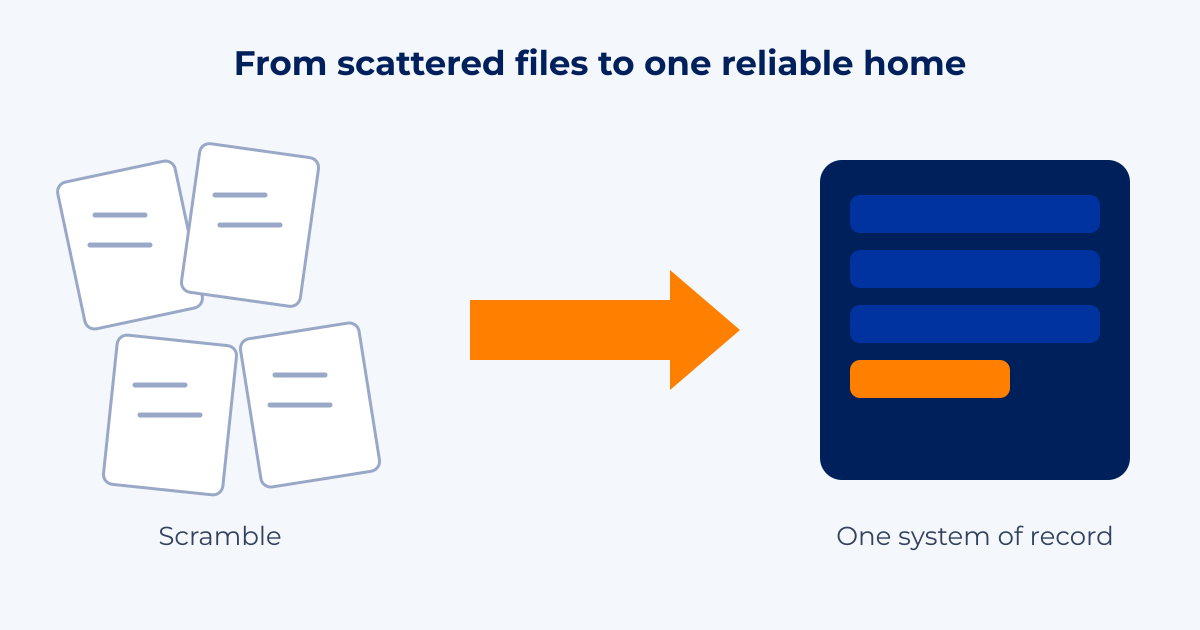
That home can take different forms depending on your size and needs. It might be a well-structured database, a purpose-built program tracking system, or a connected set of tools feeding one shared dataset. The specific tool matters less than three properties:
- One source of truth: If two people can open two different versions of the same number, you do not have a system of record yet.
- Structured at the point of entry: Dropdowns, required fields, and consistent formats prevent cleanup later.
- Built to be read by reports: The structure should anticipate the questions on your measurement plan so reports update automatically when data changes.
What Does Manual Reporting Really Cost?
Manual reporting costs time and accuracy, and both costs fall on the people closest to the work.
1. The Cost in Operational Time
The Center for Effective Philanthropy (CEP) asks grantees in its Grantee Perception Reports how much time they spend on monitoring, reporting, and evaluation. For the typical grant, CEP's Kevin Bolduc wrote in 2021, it is about 8 hours per year, and often 30 hours or more across the life of a grant. Multiply that by every grant, program, and funder a team manages and the hours add up. CEP also reports that questions about reporting have historically drawn some of the lowest ratings in its survey, including how helpful a funder's reporting process is in strengthening grantees. The core signal remains: reporting effort is real, and effort without perceived usefulness creates operational burnout.
2. The Cost in Data Accuracy
A study published in BMJ Open measuring manual data entry found an overall error rate of 2.8 percent, with individual fields ranging up to 6.4 percent. While conducted in a clinical setting, it illustrates a universal rule of data architecture: every time a staff member retypes or manually copies a number between files, risk enters the system.
The lesson is not that teams are careless. It is that systems should handle repetitive data transfers so people can focus on strategic execution.
What Does Reporting That Lasts Look Like?
Reporting that lasts is built once, tied directly to the measurement plan, and refreshed from the central data home rather than rebuilt for each request. It has four distinct traits:
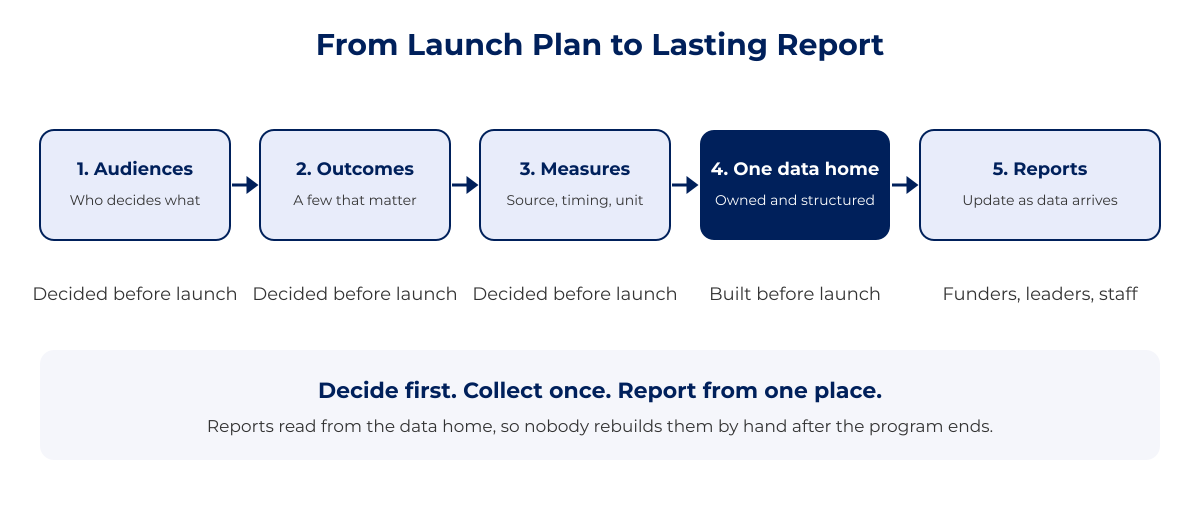
- It answers the questions you wrote down. Because outcomes were chosen before launch, the report layout is already designed. You aren't hunting for a story; you are reading the one you planned to tell.
- It updates without a manual project. When the data home is structured for reporting, a new record populates the next view automatically. Mid-program check-ins become a matter of opening a dashboard, not scheduling a manual data pull.
- It survives staff changes. Written definitions, named owners, and a documented measurement plan mean a new coordinator can pick up where the last one left off. Institutional memory lives in the system, not in someone's head.
- It supports multiple audiences cleanly. The same underlying dataset can power a funder summary, a leadership view, and a front-line tracker. Because everything draws from one home, numbers agree across all views.
What If the Program Has Already Launched?
You can still recover. Start by writing the one-page measurement plan as if you were launching today, then compare it to what you have collected so far. You will find three categories of data:
- Data you have in usable form: Move it into your single system of record and assign an owner.
- Data that needs cleanup: Perform the cleanup once, document the rules clearly, and ensure bad input paths are closed.
- Data you never collected: Decide whether you can collect it going forward. If not, note the gap openly in your reporting. Honest operational limits build more trust with stakeholders than a polished number that cannot be explained.
A Pre-Launch Measurement Checklist
Use this 10-point checklist before any program, app, or survey goes out the door. If you cannot check an item, resolve it first.
How Do You Keep the Plan From Becoming Shelfware?
A measurement plan only helps if people use it. Keep it short enough to read in five minutes, store it where the team already works, and review it at set checkpoints: before launch, at the midpoint, and at wrap-up.
Route every change through the designated data owner so definitions stay consistent. When the plan, the data home, and the reports share the exact same operational language, reporting ceases to be a separate task. It becomes an automatic byproduct of the work itself.
Frequently Asked Questions (FAQ)
When should we decide what to measure for a program?
Decide before the program or survey launches, ideally during the initial planning phase. Outcomes chosen up front shape what you collect, when you collect it, and how it gets reported. Choosing later usually means working with data that was collected for a different purpose.
How many outcomes should a program measure?
Fewer than you think. A handful of well-defined outcomes you can measure consistently is far more useful than a long list measured unevenly. Prioritize outcomes tied directly to decisions your leadership or funders will actually make.
Where should program data be stored?
In one system of record with a consistent structure, clear ownership, and required fields at the point of entry. The specific tool can vary, from relational databases to integrated workspace systems, but every measure should be stored once and read by your reports rather than copied between files.
Do we need special software to build lasting impact reporting?
Not necessarily as a first step. The most important work is operational planning: clarifying audiences, outcomes, measures, definitions, and owners. Once those are settled, choosing or configuring a data home is far easier than buying a tool first and forcing your questions to fit it.
What if our program already started without a measurement plan?
Write the plan now, audit your existing data against it, and transition usable data into one central home. Document any unrecoverable gaps openly. You will recover most of the program's reporting value by establishing clean data architecture from this point forward.
Note: This article shares Blueprint's perspective and general guidance for educational and illustrative purposes. Every organization, program, and regulatory environment is different, so adapt these ideas to fit your context.

Real talk on systems work
Get practical insights on automation strategy, vendor selection, and building systems ready to scale. The kind of advice that saves you thousands and six months of headaches.